Join us for a short walk down Kaizen Road where we’ll explore a recent journey we had in rolling out new case queue stats…
One of our core values is Kaizen, the practice of Continual, Never Ending, Improvement.
When we train customer support teams and managers, we often talk about the reports that matter most being the Case Movement Report and the Feedback Rating Report.
Those are great to look at from time to time, but we wanted that reporting data to be right where it mattered most – in the case queue for support reps and managers to see at a glance how long it was taking for cases to be assigned, first responded to, and resolved, and how satisfied customers were with the handling of their cases.
After dialing down the stats that we felt mattered most, we played around with a number of ways to present this information to the team.
What we were planning to go with was a bar above the fold between the case queue title and the case queue actions that showed the stats and what they were.
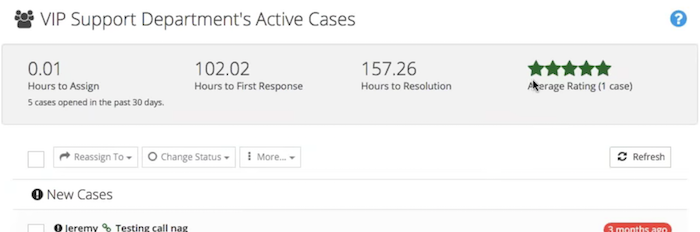
We started floating this idea past some of our customers and started gathering feedback.
This format consumed a LOT of real estate up top, and once you knew what the numbers meant, having the long definitions there all the time was a real waste of space.
We reduced the padding in the box, made the font smaller, and tried a few variations, but at the end of the day, it was simply too cumbersome.
Next up, we decided to place the stats inside the case actions bar at the top of the queue! Brilliant!
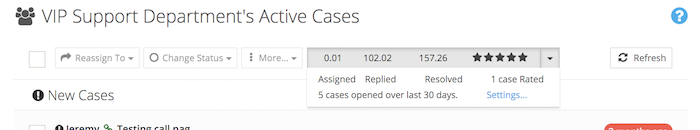
When you clicked on the stats, we’d open up a box that tried to shed some light on what you were looking at. Again, the idea was that you’d have quick visibility to the numbers and stats you needed, and then you could click for more details.
This was okay, but lacked the units (hours) and didn’t explain things as well as it could.
So we went with a longer explanation in plain English of what the stats were.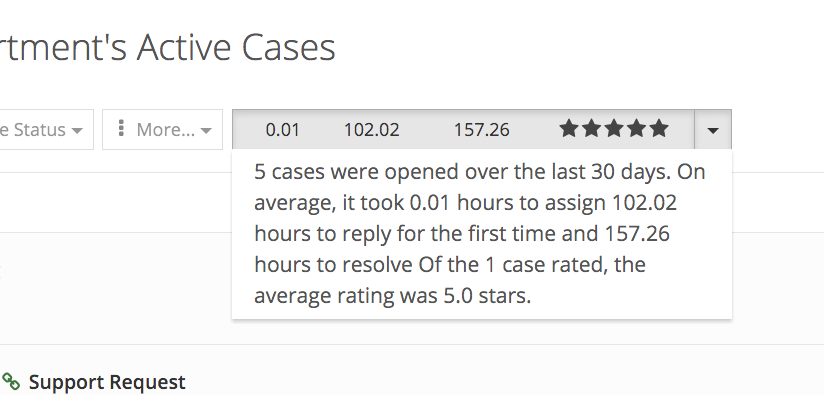
That seemed to be a misuse of a button and dropdown, though, and that’s when it hit… let’s go with a popup (that shows up when you hover over or click the stats) explaining what the numbers mean!
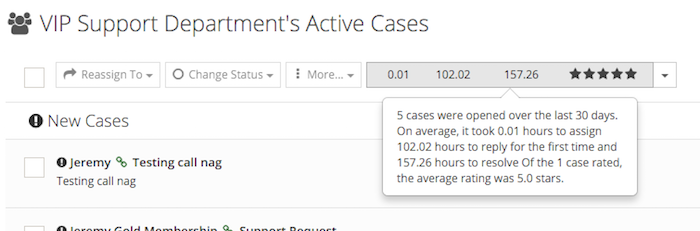
Almost there. Let’s get rid of the button style entirely and convert those decimal times to hours:minutes up top and plain English in the description.
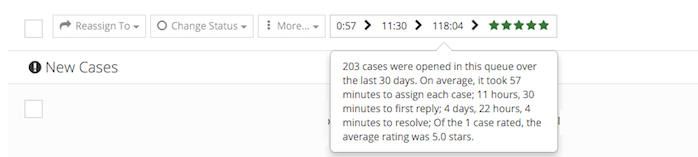
Boom. Done. All the stats you need with instant access to all the details just by clicking or hovering.
These iterations wouldn’t have been possible without the continual feedback from our customers and our commitment to doing something right when we’re going to do it (another core value)!
Now reps and managers alike can at-a-glance see how long it takes for cases to be assigned, first responded to, and resolved, as well as see how well they’re doing from the customers perspective. Furthermore, this is all delivered with maximum visibility with minimal intrusiveness!
Is this perfect? Never. Is this done? For now. Will it change in the future? If we can improve it, YES!