Many FuseDesk reports average data in a period of time for you, for example, the average first response time per week or the average case rating per month.
At the top of reports that average data, we’ll show you the Average of the Average in the report legend.
It’s important to note that an Average of the Averages is not the same as an Absolute Average.
If, for example, in a Case Rating report, let’s say you have 1 case that gets rated on a Monday with one star 20 cases that get rated on a Tuesday with 5 stars.
The Absolute Average rating will be 4.95 stars ((1 + 20*5) / 21).
The Average of the Average, however, in a report broken down daily, will be 2.5 stars ((1 + 5) / 2).
That’s quite a big difference.
That’s also a very extreme example.
Real world data is typically less extreme and more evenly distributed.
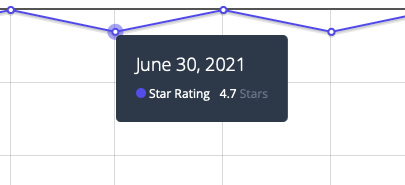
To see what the average is for a period of time in your report, simply mouse over the time period and we’ll show you the average for just that time period.